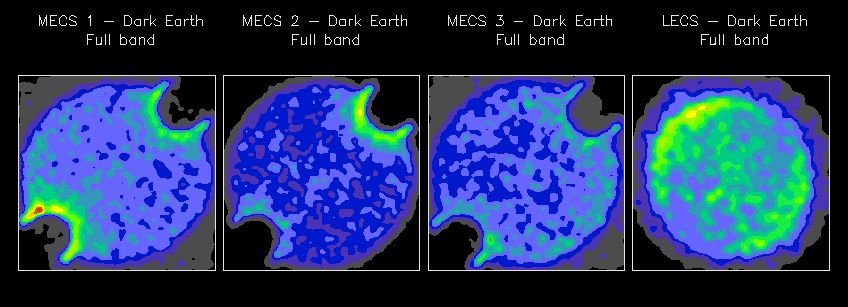
 We have also produced maps of the Dark Earth background in different
energy band (for the MECS we added the maps of the three
detector together):
LECS and MECS Dark Earth background events have been accumulated during the SVP and the AO1 phases. Observations extracted from the SAX SDC Science archive span about 220 days from mid August 1996 to April 11 1997. The total net exposure time of the observations analyzed in this report is 460 ks in the MECS and 84 ks in the LECS.
The following figure shows full energy band Dark Earth background maps in the three MECS units and in the LECS.
 We have also produced maps of the Dark Earth background in different
energy band (for the MECS we added the maps of the three
detector together):
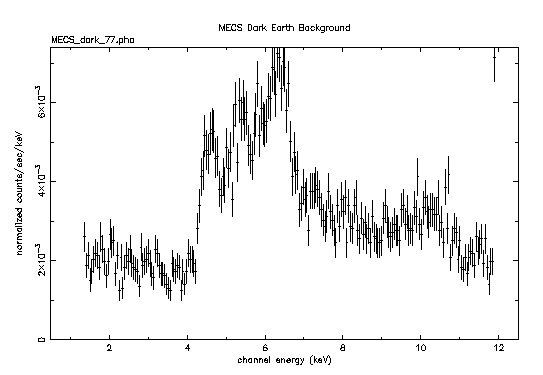
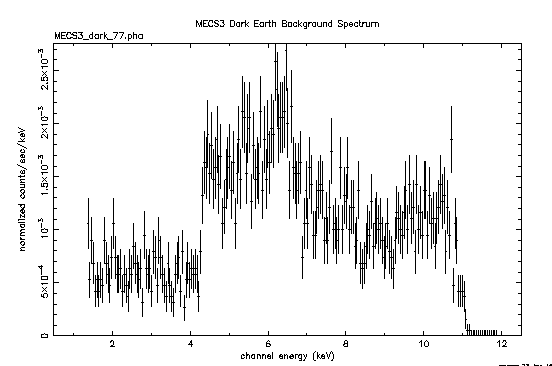
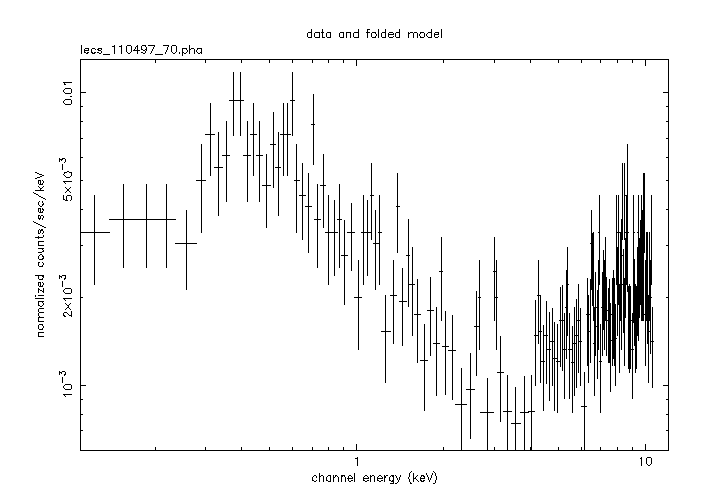
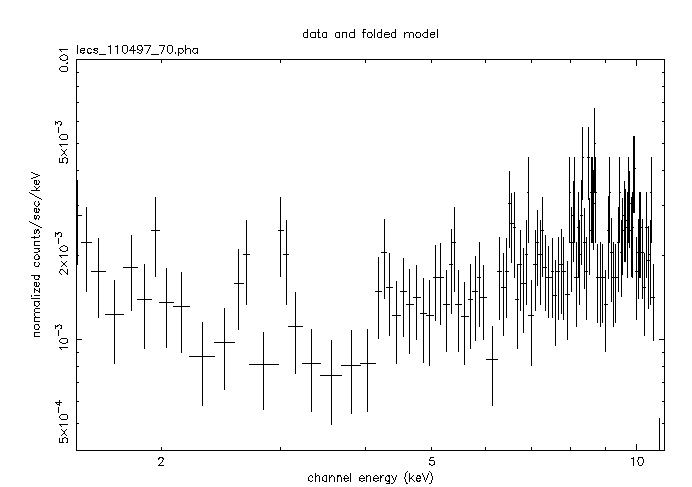
From the analysis of these maps is clear that the contribution of the fluorescence photons of the calibration sources is non-negligible at the center on the detector too. The three MECS spectrum of the Dark Earth background accumulated on the central 10 arcmin shown below is in fact dominated by a line feature at about 6 keV, due to this effect.
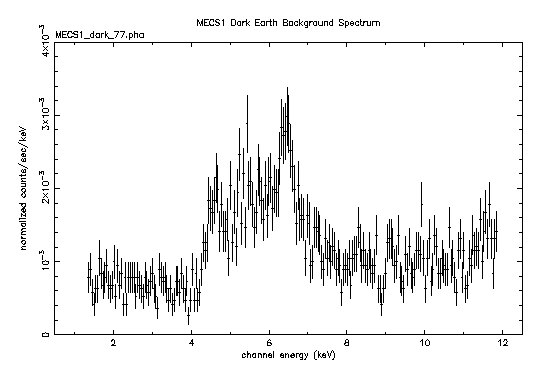
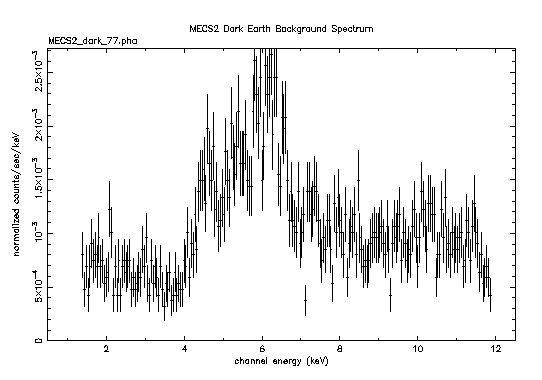
 The `three peaks' feature is present in the spectra of each single
MECS units:
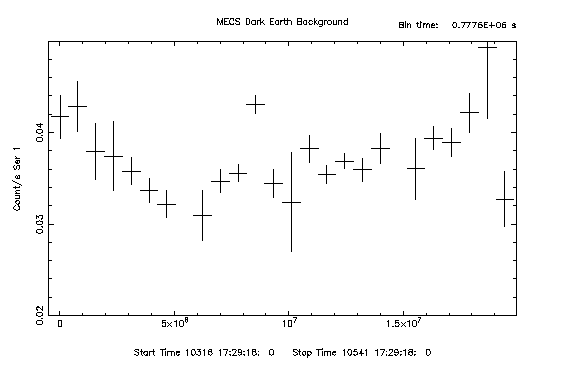
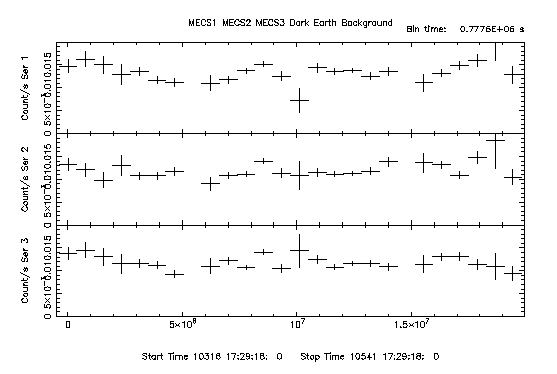
Finally, we studied the time evolution of the LECS and MECS internal background. The following figures show the light curves of the dark Earth background (1.5-10 keV MECS, 0.1-10 keV LECS) estracted from a region of 10 arcmin radius at the center of the detectors.
The light curves of the three MECS units added together.
The light curves of the single MECS units
The LECS light curve
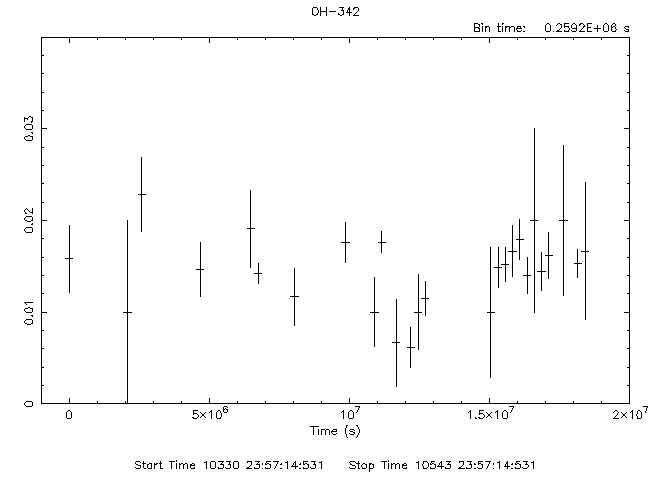
The MECS light curves show significant epochal variations, which are in any cases at most 30 % of the mean background level.
Please send questions/problem reports to: helpdesk@sax.sdc.asi.it