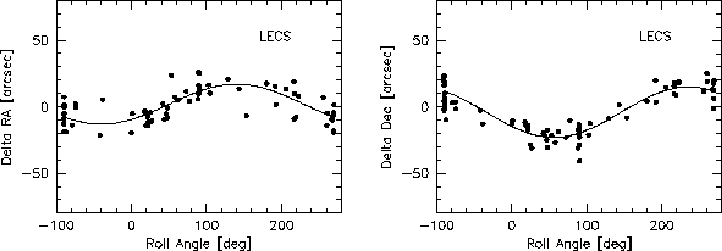
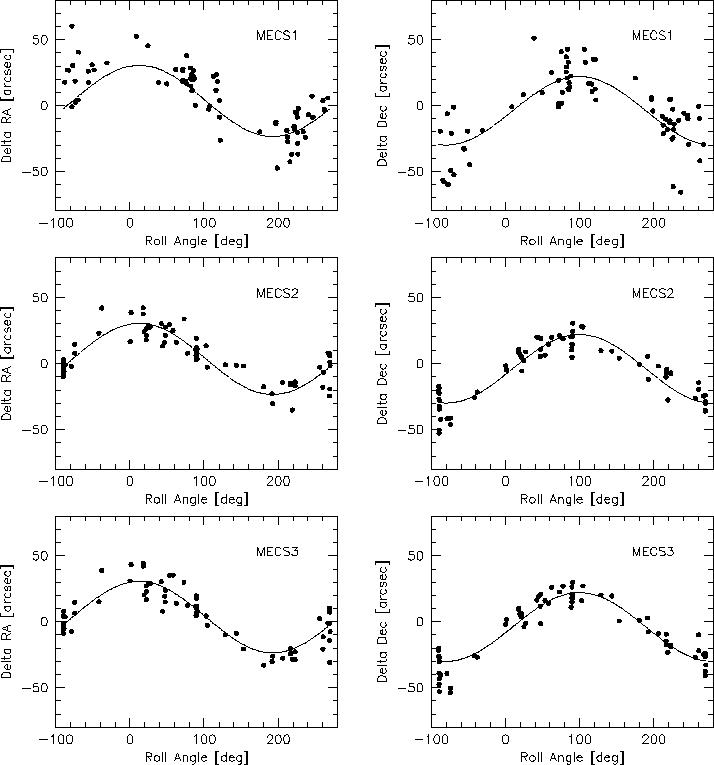
Figure 2:
The differences in RA and Dec between LECS and MECS X-ray positions and optical positions plotted as a function of the spacecraft roll angle. The solid lines are best fits to the data and are discussed in the text.