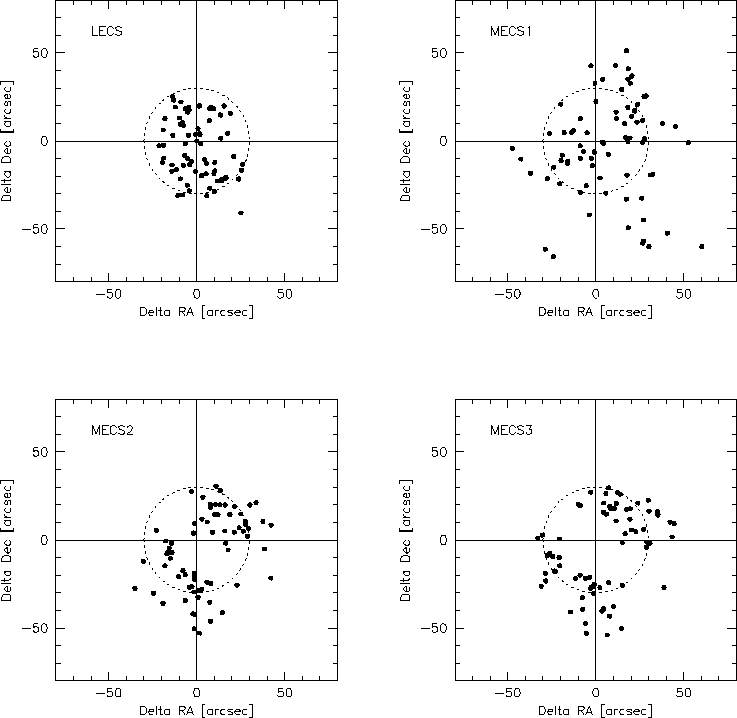
The results are shown in Figure 1 where the deviations in RA and Dec
between the LECS and MECS X-ray sky positions and the optical positions
are plotted. Note that differences have been computed subtracting the X-ray
value from the optical one and that RA differences are corrected by the
factor cos(Dec) and represent the true separation in the sky:
![]()
![]()
We have then computed the radial distance between the X-ray and optical
position and the ``radius'' within which 68% and 90% of the objects are
included. The results are summarized in Table 1.
| Instrument | 68% error radius | 90% error radius |
| LECS | 23'' | 29'' |
| MECS1 | 38'' | 53'' |
| MECS2 | 30'' | 42'' |
| MECS3 | 32'' | 43'' |
From Figure 1 and Table 1 some issues can be pointed out.
First, MECS1 X-ray positions are significantly affected by larger errors
than MECS2 and MECS3, as a result of the worse absolute attitude reconstruction
of the spacecraft during the first two years of the mission. An analysis
of MECS2 and MECS3 images from May 1996 to May 1997 confirms this interpretation:
MECS2 and MECS3 error radius values during this period are nearly identical
to those of MECS1.
Second, RA and Dec deviations for MECS2 and MECS3, and marginally for
MECS1, are not uniformly distributed around the zero values, suggesting
the presence of some problems in the telescopes misalignment calibrations.
 |