The cross-calibration issue involves different areas:
| ksec | counts s-1 | Gamma | NH (10**21 cm**-2) | ||
| LECS | 2.0 | 0.12-9 keV | 208 | 2.076 | 3.28 |
| MECS1 | 19.1 | 1.65-11 keV | 108 | 2.083 | 2.87 |
| MECS2 | 18.6 | 1.65-11 keV | 131 | 2.104 | 2.99 |
| MECS3 | 18.5 | 1.65-10 keV | 134 | 2.098 | 3.03 |
| MECS | 1.8-10.5 keV | 362 | 2.073 | 2.68 | |
| HPGSPC | 8.1 | 7-60 keV | 192 | 2.050 | 3.0 (fixed) |
| PDS | 9.6 | 13-200 keV | 176 | 2.113 | ... |
LECS and MECS spectra have been extracted from 8 arcmin radius regions. They are not background subtracted. the PDS spectrum is the sum of the spectra of the four PDS crystals. HPGSPC and PDS spectra are background subtracted.
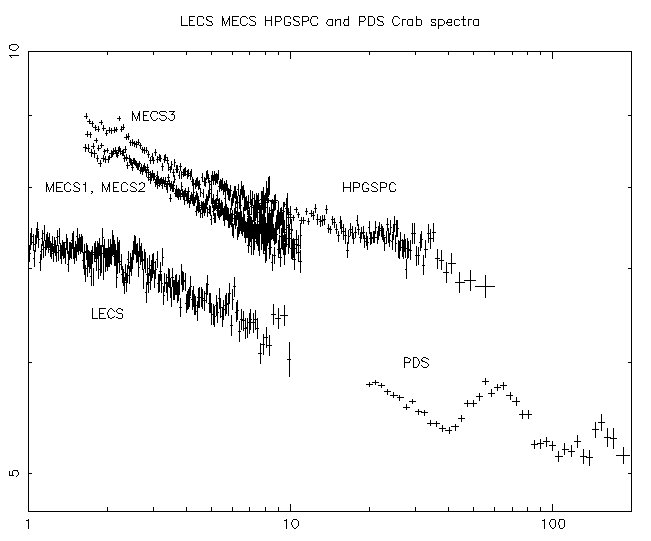
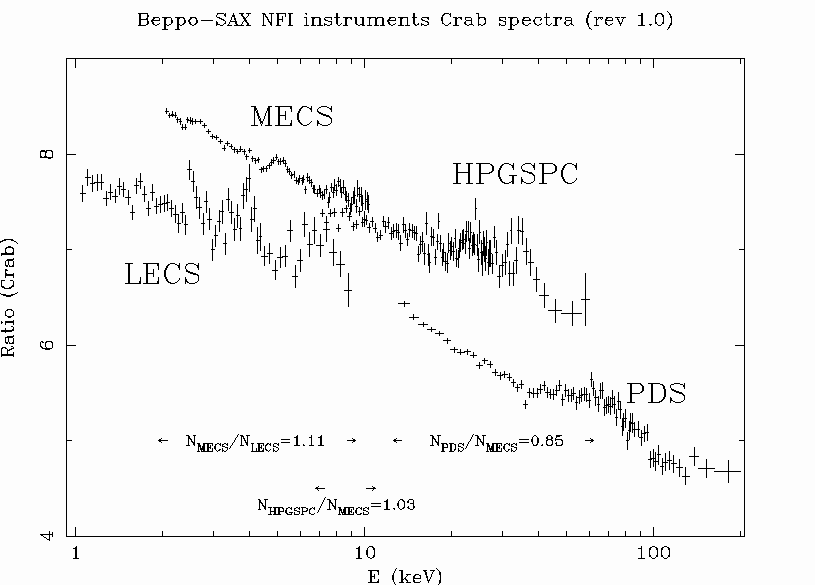
The figures below show the 6 NFI spectra (LECS, three MECS units, HPGSPC and the sum of the four PDS crystals) of the Crab nebula normalized by a simple absorbed (NH=3.3 × 10**21 cm-2) power-law spectrum with a spectral photon index equal to 2. The response matrixes are the one available on-line from September 1, 1997. The upper panel refers to the first issue of software and calibrations (January 31, 1997), while the lower panel to the current version (Rev 1.0).
The figure and the table show that the slope of the Crab in the 2-10 keV energy range in the MECS units and in the LECS and in the MECS units and the PDS in the 13-200 keV agree within 0.5%, while it is flatter in the HPGSPC 7-60 keV range by 2.5 %.
The Crab emission is made up of two distinct components: the pulsar emission and the nebula emission. It is known from phase resolved spectroscopy that the pulsar emission is harder than the nebula emission. An analysis is ongoing to disentangle the different components contributions. It will help in clarifying also the cross-calibration issue on the whole Beppo-SAX broadband.
The figure also shows that there are small differences in the relative normalization. Because of the large energy range covered by the instruments, small differences in slope can reflect themselves in huge differences in the 1 keV normalizations (that can however be read from the figure if one extrapolates the spectra); for such a reason, we prefer to comment on the differences in the normalization in the energy ranges common to the various instruments. We note that:
The above number are reported in the figure, where the arrows indicates the ovrelapping energy bands on which they were estimated. They give the limits of the present flux cross-calibration of the instruments. The reasons for these differences are currently under investigation. Any significant improvement in the flux cross-calibration will be promptly communicated.
LECS and MECS energy cross-calibration can be tested using the spectrum of the superova remnant CAS A, which is reach in emission lines. The table gives the position of 5 lines in the LECS and in the three MECS, computed using the redistribution matrices avalable on 1-Jan-1997, and compares them with the line positions found by the ASCA SIS (Holt et al., 1994) and the lab energy of the atomic lines.
| Line | Lab | ASCA SIS | LECS | MECS1 | MECS2 | MECS3 |
|---|---|---|---|---|---|---|
| Ne Lya-Fe-L | 1.02-1.08 | 1.02-1.09 | 1.06 | |||
| Mg He_a-Lya | 1.35-1.48 | 1.35-1.49 | 1.40 | |||
| Si He_alpha | 1.85 | 1.854 | 1.88 | 1.87 | 1.87 | 1.86 |
| Si He_beta | 2.20 | 2.200 | 2.28 | 2.21 | 2.21 | 2.20 |
| S He_alpha | 2.45 | 2.444 | 2.45 | 2.46 | 2.42 | 2.45 |
| Ar He_alpha | 3.12 | 3.120 | 3.06 | 3.10 | 3.07 | 3.08 |
| Ca He_alpha | 3.87 | 3.869 | 3.86 | 3.92 | 3.90 | 3.91 |
| Fe He_alpha | 6.60 | 6.586 | 6.58 | 6.73 | 6.65 | 6.68 |
| ??Fe He_beta?? | 7.87 | 7.87 | 7.85 | |||
At the moment the statistics on LECS and MECS position reconstruction is limited. This study is under way and here we present only preliminary results concerning source positions in the central 10 arcmin of the field.
The analysis of two bright sources (MECS count rate, three units, higher than 10 counts s-1), two medium bright sources (MECS count rate between 1 and 5 counts s-1) and two faint sources (MECS count rate between 0.1 and 1 counts s-1), and of 14 short observations of LMC X-3 (a raster scan performed in the Science Verification Phase) revealed that:
Very preliminary results on sources outside the central 10 arcmin of the LECS and MECS FOV show that the absolute position reconstruction is less accurate (of the order of 1-1.5 arcmin). The reason of this imperfect calibration is under investigation.
We are confident an absolute position reconstruction significantly better than 1 arcmin can be achieved over the entire LECS and MECS FOV.